Policy Compliance
The Policy Compliance Dashboard in SP360 offers visibility into how well your environment aligns with a broad range of IT compliance standards. This view helps you assess compliance performance across key controls and assets in real time.
SP360 currently supports 28 industry-recognized audit standards (referred to as policies), including SOC2, CMMC Level 1v2, and CCPA, among others. These examples are provided for reference only – each organization will typically select a custom subset of policies relevant to its regulatory or business requirements. Click here to view the complete list of supported standards.
This module is available as an add-on, extra-cost feature and can be enabled for subscribed users to support audit readiness and regulatory adherence.
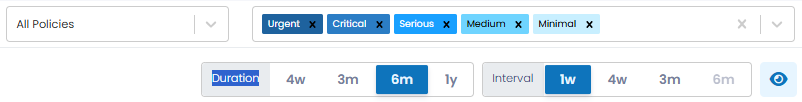
Filtering Chart Content
For ease of use, the dashboard has a dropdown filter and options/buttons at the top of the dashboard that can be used to filter the chart information by compliance standard or standards. In addition, the last section of the dashboard (i.e., the Host Asset list) allows you to include or exclude the Host Assets that contribute to the compliance data.
| Options/Buttons | Descriptions |
|---|---|
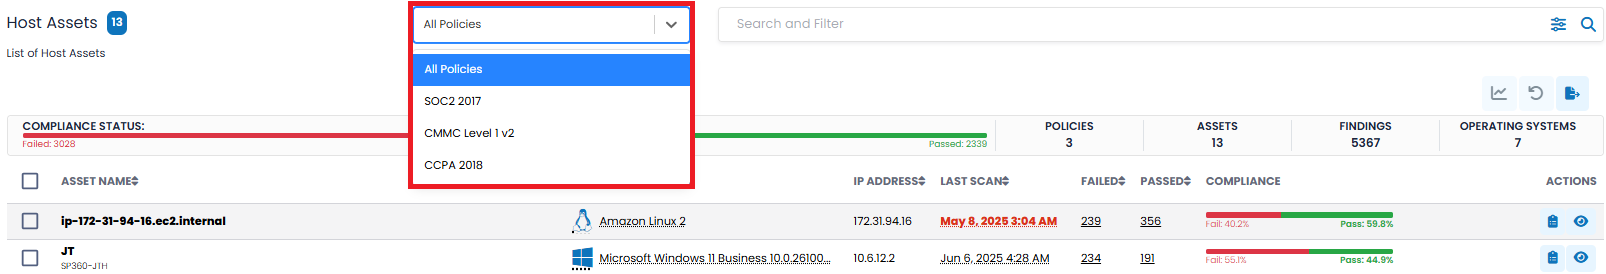
| Policy Dropdown Filter |
From this dropdown you can select the specific IT compliance standard(s) within your organization’s configured scope. At the time of purchase, each organization designates which compliance policies are relevant to them. Only those pre-configured policies will appear in this dropdown menu. The examples listed below are for demonstration purposes only.
|
| Severity | From this drop-down you can select one or more severities of interest to alter the charts accordingly. The severity of each finding (which will either Pass or Fail) is classified as either Urgent, Critical, Serious, Medium, or Minimal. |
| Duration | Using this control, you can establish the time-period the chart covers. The available options are 4 weeks, 3 months, 6 months or 1 year. |
| Interval | Using this control, you can establish the period of time each data point represents. The available intervals are 1 week, 4 weeks, 3 months, 6 months or 1 year. This option allows you to view the trending over the desired time periods; for example, month-over-month, or quarter-over-quarter. |
| To view the Finding (Pass/Fail) counts for each interval in all the charts you can use this toggle button. This removes the need to hover over the chart. |
The Policy Compliance dashboard provides information in two sections:
- Compliance Trending History
- Current Findings Status
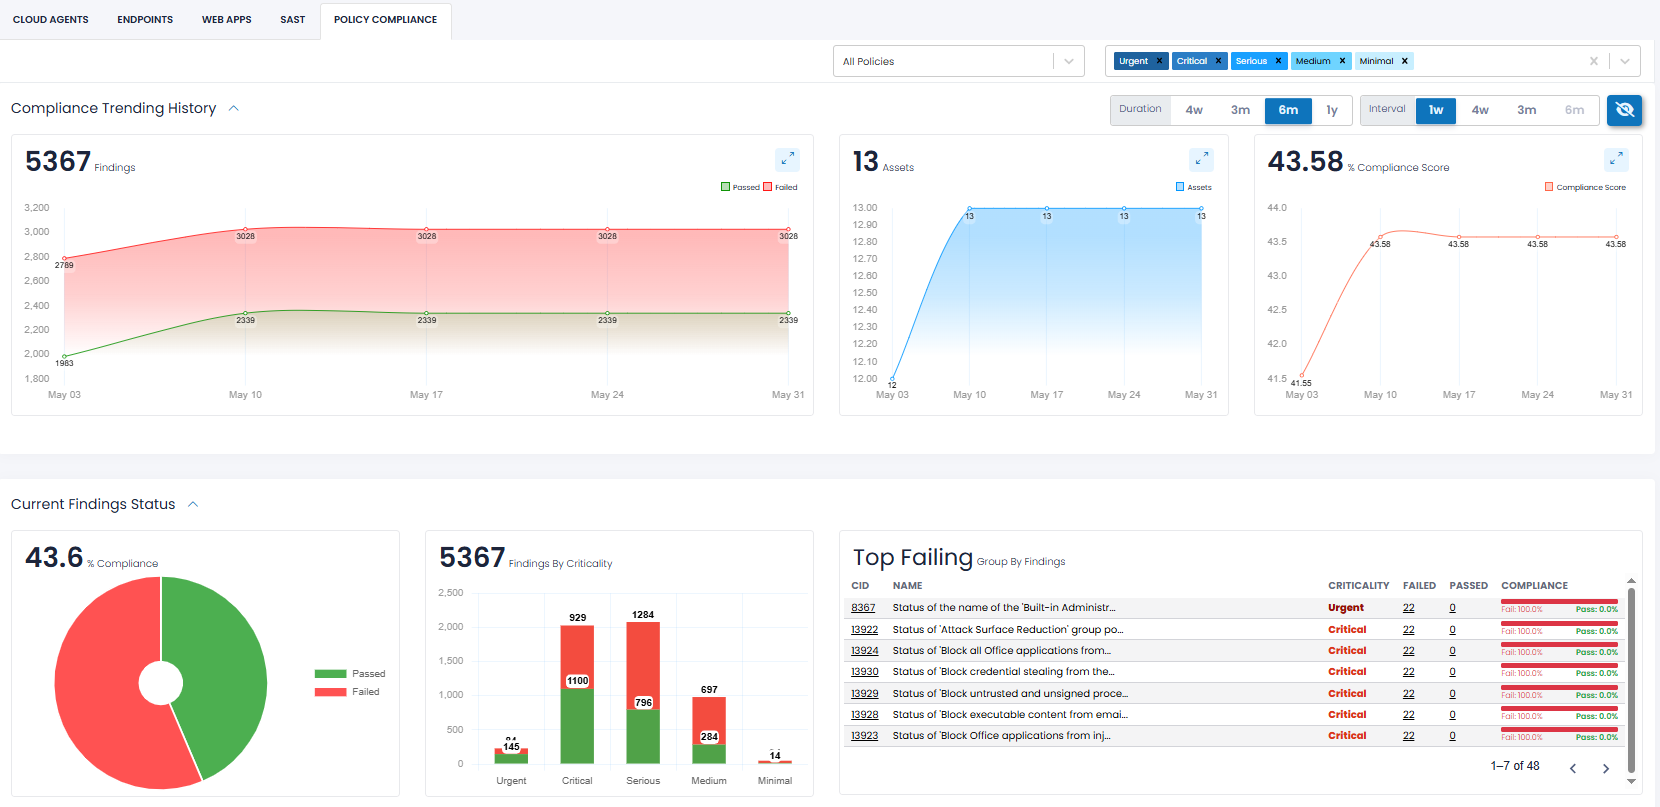
Compliance Trending History
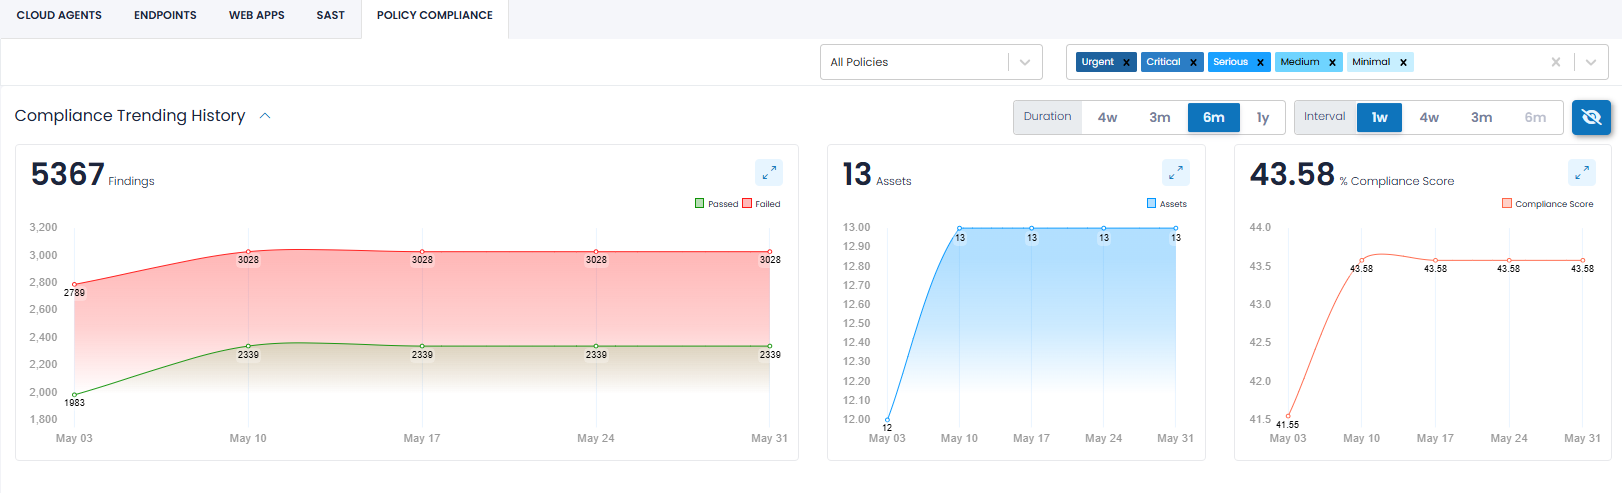
The Compliance Trending History provides a historical view of your policy compliance over time. The data is displayed in charts (as shown above) and segmented with a separate chart for:
- Findings – Total number of compliance checks (both passed and failed) across the selected time period. Note that for a fixed number of assets and a static list of policies, the number of findings will never change, only the number that have passed or failed.
- Assets – Displays how many Cloud Agent assets were evaluated in the selected timeframe. It is important to know how many assets are being evaluated, and which those are. An increase or decrease in the number of assets will impact the number of findings.
- Compliance Score – A percentage metric representing your overall policy adherence rate (i.e., number of findings that have passed divided by total number of findings).
Current Findings Status
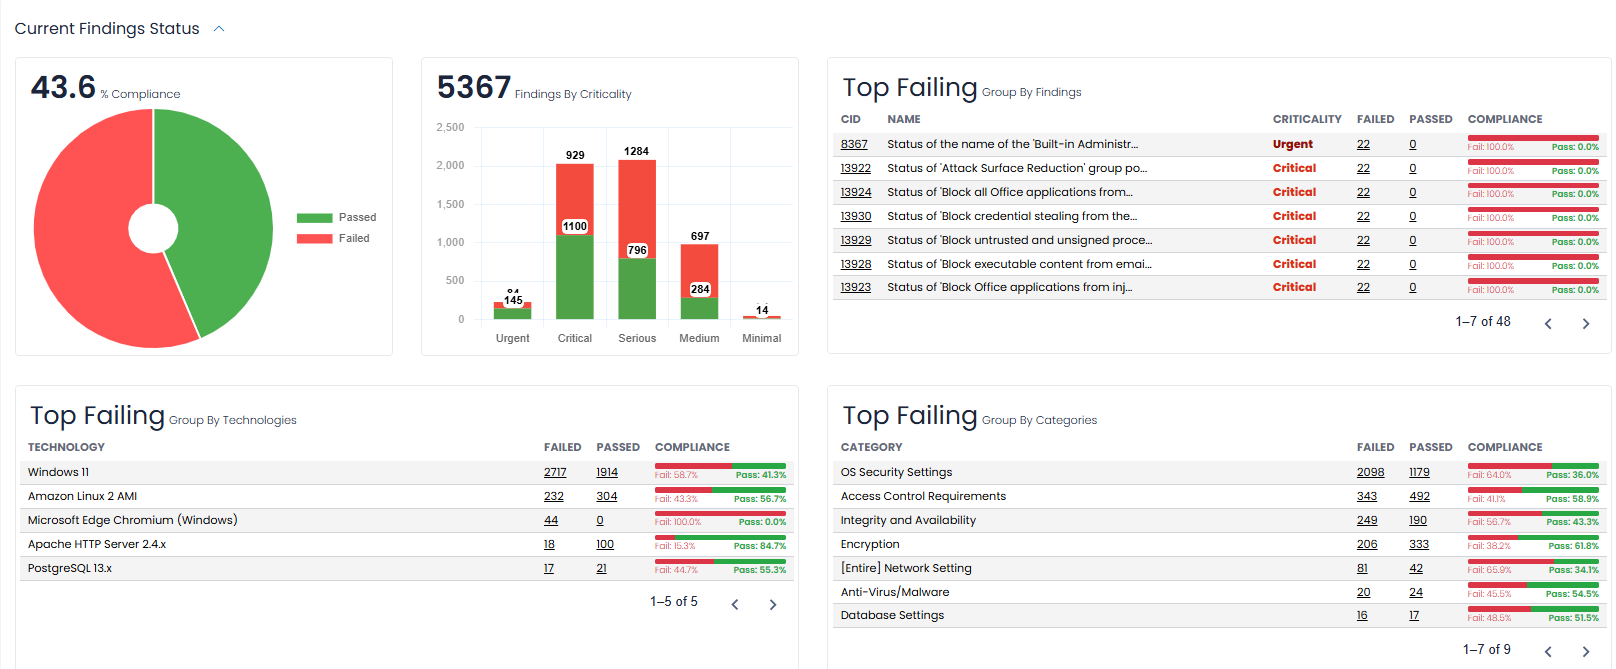
This section summarizes the current compliance posture utilizing the following charts:
- Compliance Pie Chart – Visual representation of all evaluated findings, divided into “Passed” and “Failed.”
- Findings by Severity – Stacked bar chart showing pass/fail counts across each severity level.
-
Top Failing (Group by Findings) – A tabular list grouped by individual Control Identifiers (CIDs). This will help you focus on the types of findings that fail most often. Each entry shows:
- CID – Control Identifier (clickable). When clicked, you will “drill down” to the Policy Compliance Findings page for that set of failed Findings.
- Name – Control description, that is, a description of the control (check) that failed.
- Severity – Severity level (Urgent, Critical, etc.)
- Failed/Passed – Number of failed and passed evaluations (clickable). Also drills to the Policy Compliance page for the set of failed Findings.
- Compliance – Percentage pass/fail rate for the control.
- Top Failing (Group by Technologies) – Highlights technologies with the highest concentration of failed controls (e.g., Windows 11, Edge Chromium). Again, this allows you to focus on the technologies within your organization with the most issues.
- Top Failing (Group by Categories) – Lists common policy areas or control domains with recurring failures (e.g., OS Security Settings, Encryption).
Each table provides detailed compliance rates within its group to help identify systemic gaps.
Findings Metrics - Severity
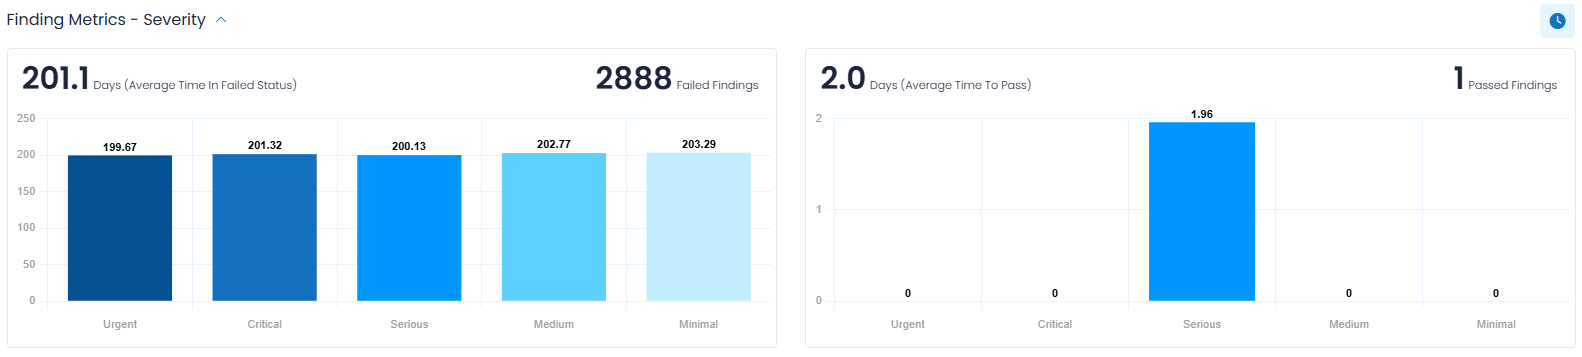
Findings Metrics (which is a collapsible section and is collapsed by default) provides insight into how long your failed Findings have remained in a failed state, and how long it took for remediated Findings to pass.
The Findings Metrics are presented in one of two formats, which can be toggled by clicking the ![]() action icon on the upper-right portion of this section. By default, the Severity-based format is shown and contains the following two bar charts.
action icon on the upper-right portion of this section. By default, the Severity-based format is shown and contains the following two bar charts.
Days (Average Time in Failed Status)
This bar chart shows the total number of failed Findings in the selected timeframe (upper-right notation) and the average number of days (upper-left notation) that Findings have remained in a failed state, broken down by severity (Urgent, Critical, Serious, Medium, Minimal).
Hovering over each bar shows how many Findings were considered for the metric calculations.
Days (Average Time to Pass)
This bar chart shows the number of Findings that passed in the selected timeframe (upper-right notation) and the average number of days (upper-left notation) that these Findings were in failed status before being remediated and marked as passed.
Hovering over each bar displays how many Findings contributed to the calculation.
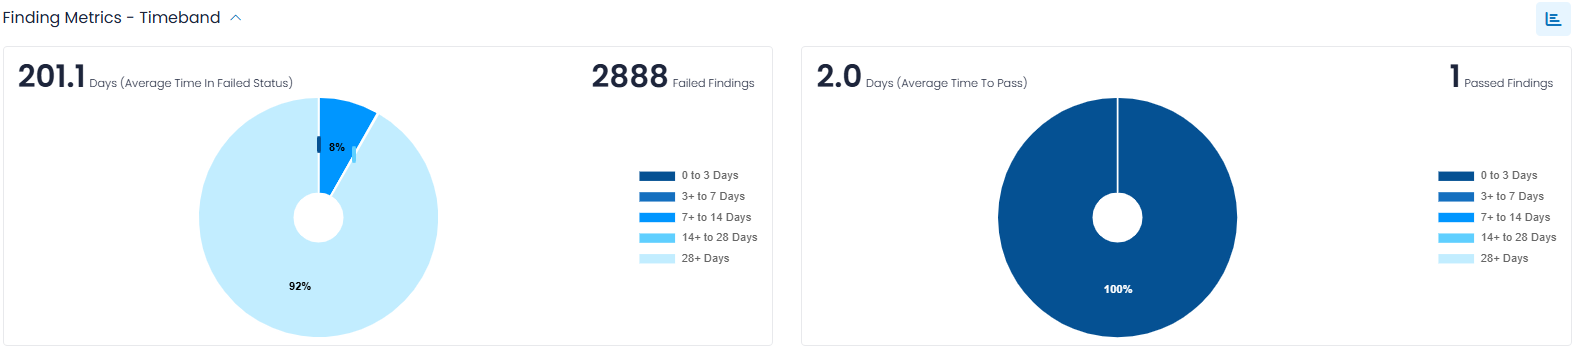
Clicking on the ![]() action icon to the far right of the Findings Metrics, the header displays a Timeband label, and breaks down the number of Findings by ranges of days, for example, those open less than three days, or between three and seven days. This data is displayed in pie-chart format for both failed and passed Findings.
action icon to the far right of the Findings Metrics, the header displays a Timeband label, and breaks down the number of Findings by ranges of days, for example, those open less than three days, or between three and seven days. This data is displayed in pie-chart format for both failed and passed Findings.
Notice that the ![]() icon used to toggle between Severity-based and Timeband-based formats changes depending on which format is currently displayed.
icon used to toggle between Severity-based and Timeband-based formats changes depending on which format is currently displayed.
Host Assets List
This sub-section of the dashboard lists all scanned Cloud Agent assets and their compliance breakdown. To better understand the operational details, let’s break down the key features this sub-section offers.
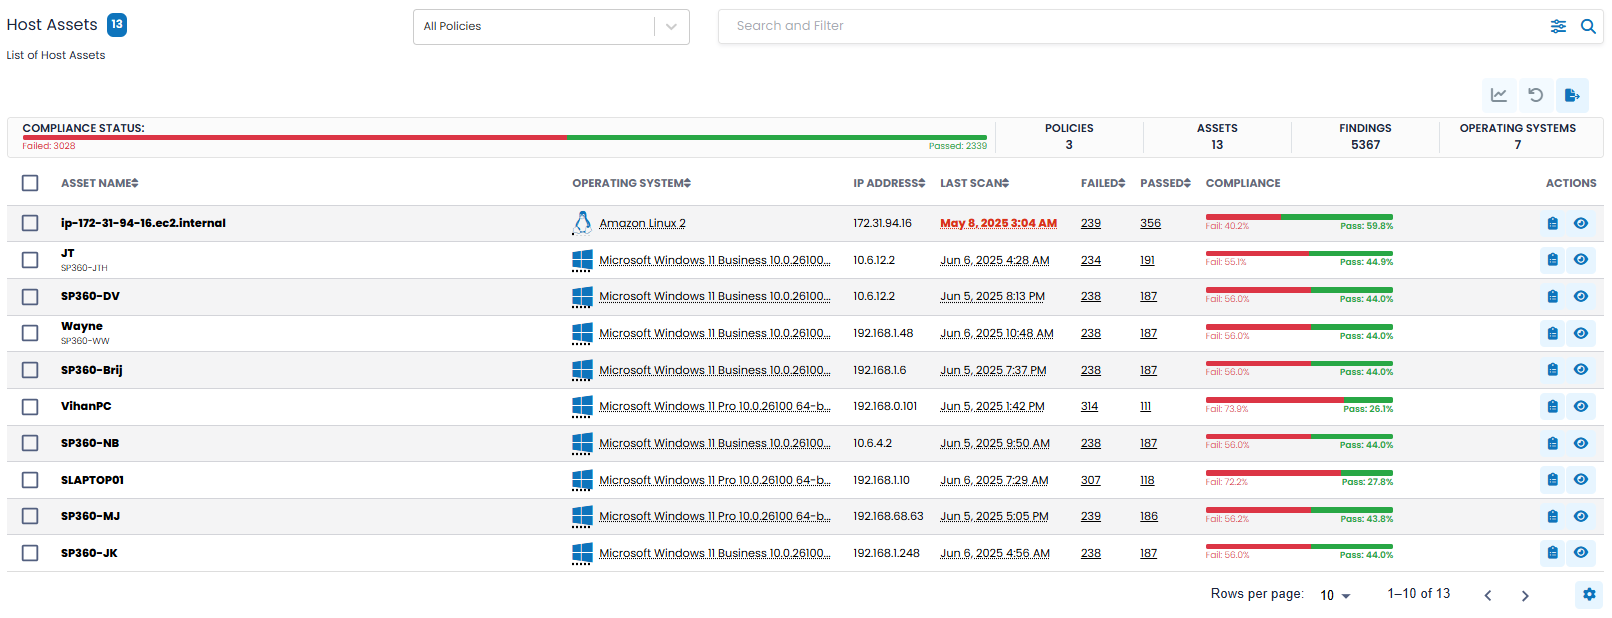
The upper left corner of the Host Assets List contains a blue box with the number of assets meeting your selection criteria.
- You can select the checkboxes on the far left to filter the data to display only assets you are interested in. As the boxes are checked, a “Selected” counter appears and is updated, and the graph icon
 becomes active. The dashboard will not reflect the changes until the graph icon is clicked.
 - Selections are retained across page scrolls, ensuring that any assets you select remain checked as you navigate through the list. To return to the default state, click the
 icon.
icon.
Filtering Options, Action Icons, and Summary Bar
To the right of the asset count, the Host Asset List offers three dropdown filters and three action icons.

Filtering Options
The three filtering options allow you to select which assets to display based on the following attributes.
| Options/Buttons | Descriptions |
|---|---|
| Policy Dropdown Filter |
From this dropdown you can select the specific IT compliance standard(s) within your organization’s configured scope. At the time of purchase, each organization designates which compliance policies are relevant to them. Only those pre-configured policies will appear in this dropdown menu. The examples listed below are for demonstration purposes only.
|
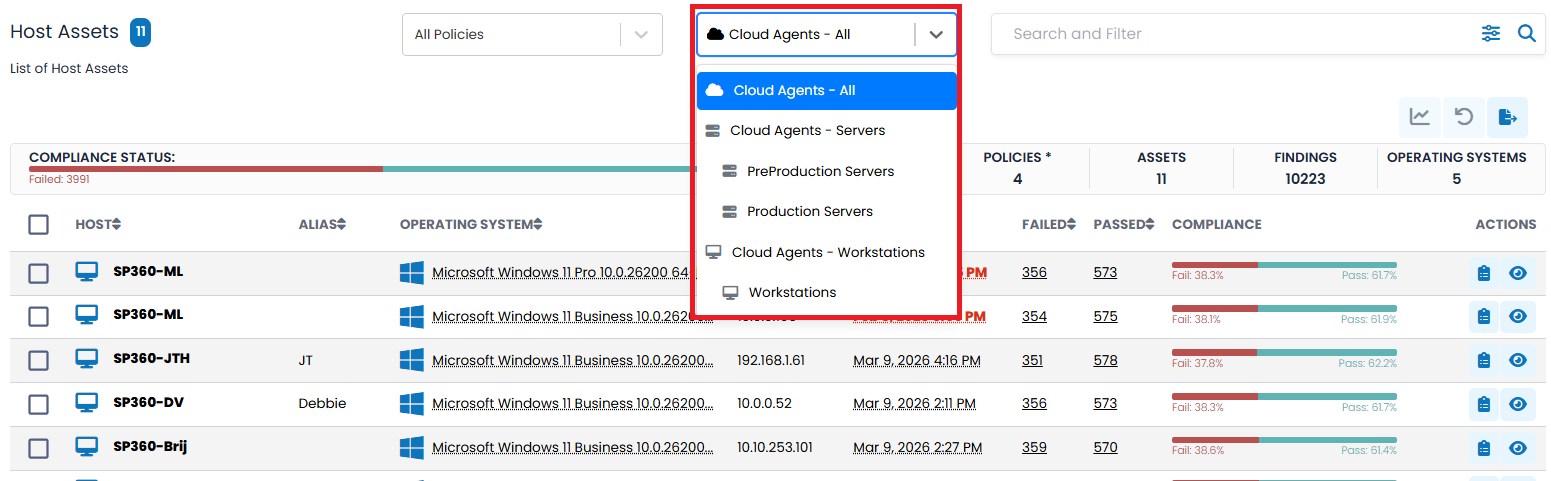
| Asset Type |
This dropdown filter allows you to refine the Host Assets List by asset type or asset group. This filter enables you to quickly focus on specific categories of assets, such as servers or workstations, depending on their operational needs. It displays predefined asset categories configured within the environment. Selecting an option updates the Host Assets List to display only the assets associated with the selected category.
Available option inclue:
|
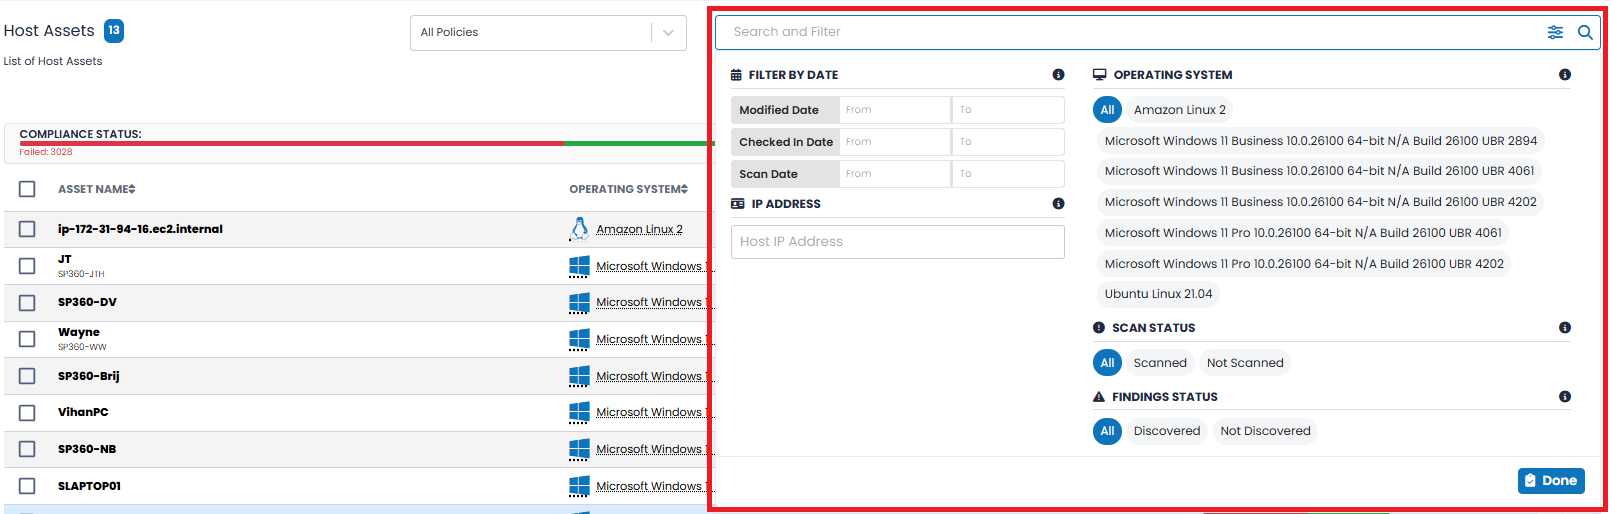
| Search and Filter Bar |
Allows you to select and filter assets based on the different attributes defined below.
|
Action Icons
| Action Icons | Function |
|---|---|
| Clicking this icon restricts the dashboard to showing only those assets selected. | |
| Clicking on this icon results in resetting the dashboard to its default state. | |
| Clicking on this icon downloads (in CSV format) all details for all/selected Cloud Agents. |
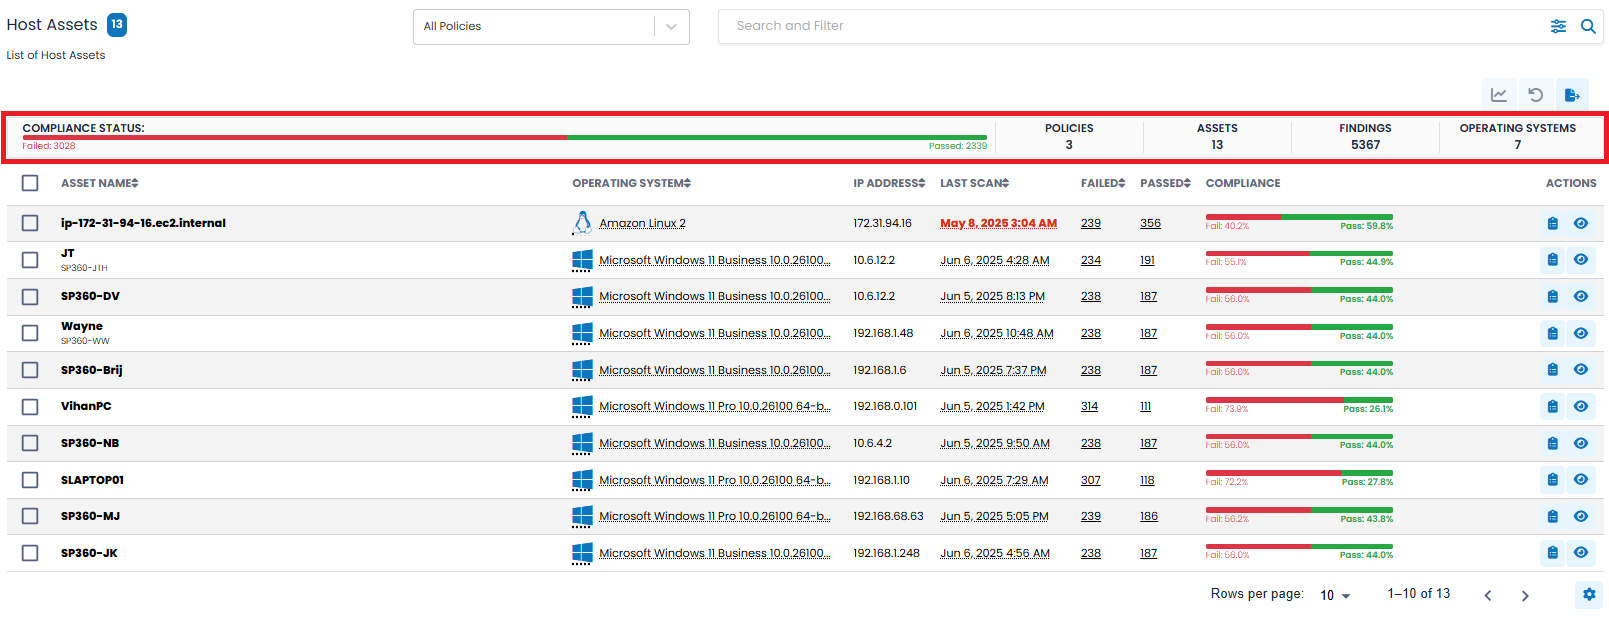
At the top of the Host Assets List, the Compliance Insights Bar provides a dynamic snapshot of your Policy Compliance posture based on the current filter selections. This bar visually summarizes the severity distribution of failed Findings, the overall compliance status (Passed vs. Failed), and key totals – including the number of policies in scope, total assets evaluated, and the cumulative number of compliance findings. An example is shown below.
The Host Assets grid includes the following fields by default, however, you can customize the grid to add, remove, or re-arrange fields to meet your needs by clicking the  action icon, explained here.
| Column Headers | Definition |
|---|---|
| Asset Name | The name of the host. |
| Operating System | The Operating System of the Cloud Agent, both the traditional icon and in full text. |
| IP Address | The IP address of the host. |
| Last Scan | The date on which the host was last scanned. |
| Failed | The total number of failed checks for the host for a selected policy or policies. |
| Passed | The total number of passed checks for the host for a selected policy or policies. |
| Compliance | The compliance status of the asset, displayed as a segmented line chart for a given asset. Failed checks are displayed in red and passed checks in blue. |
To learn more about the optional fields that can be added, removed, or re-arranged in the Host Asset grid, click here.
Row-Level Action Icons
| Action Icons | Description |
|---|---|
 |
By clicking this action icon, users can view findings associated with the selected host. |
To view the Host Asset details for a specified host, users can click this action icon. The asset details are displayed in a pop-up window, as shown below .
The Compliance tab – which is exclusive to the Policy Compliance module – presents a high-level summary of how the asset is performing against its assigned compliance policies. The tab includes:
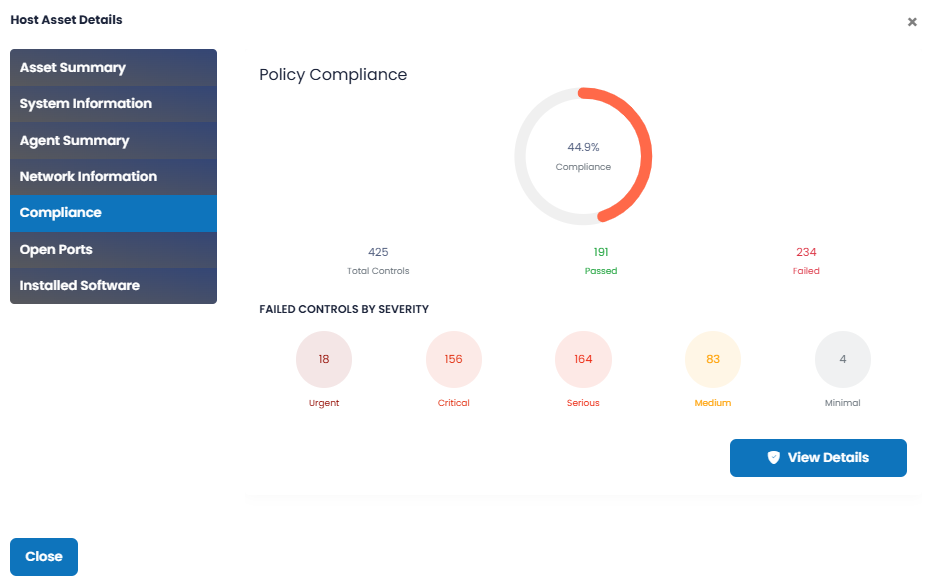
|