Policy Compliance Findings
Policy Compliance Findings (or PC Findings) refer to the gaps or violations detected during compliance assessments, where system configurations or practices deviate from industry-recognized audit standards (referred to as policies). Security Program 360 (SP360) helps identify, categorize, and track these findings, allowing users to address security posture issues systematically.
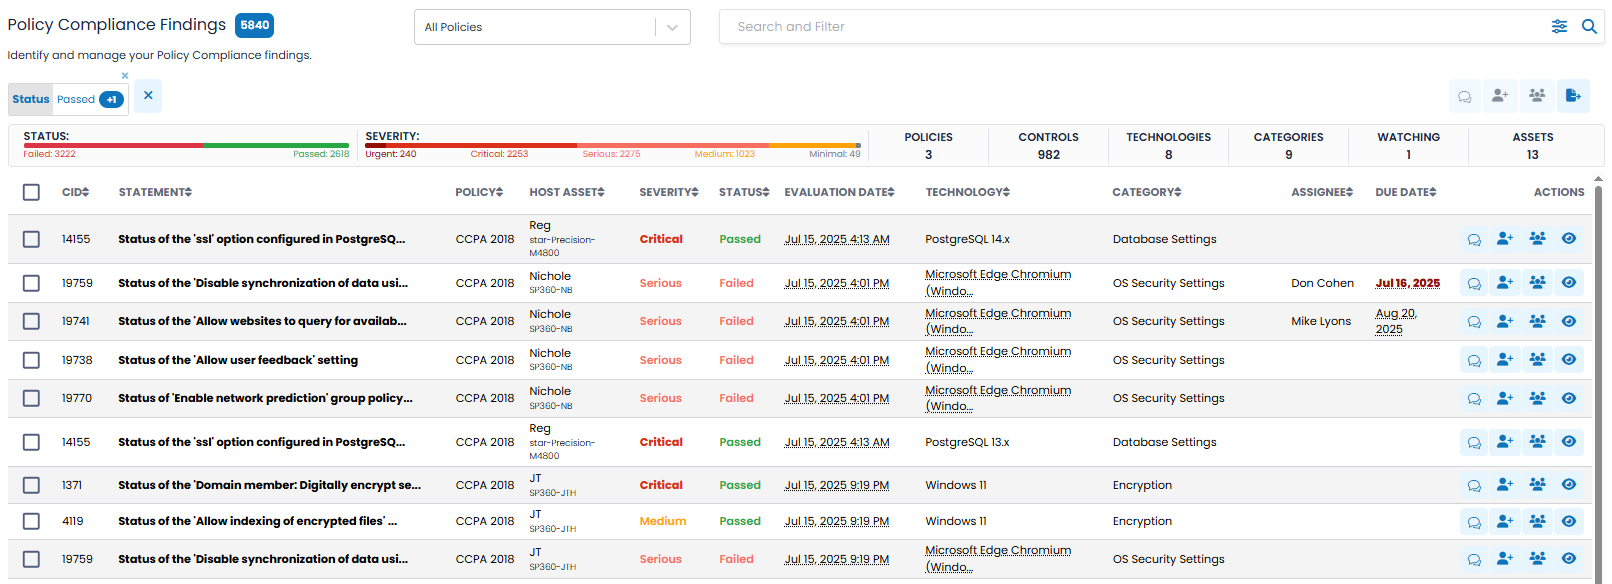
The PC Findings page provides a centralized view of compliance issues across your assets.
The upper left corner of the PC Findings page contains a blue box with the number of findings meeting your selection criteria.
Filtering and Searching Options, and Action Icons
To the right of the findings count, the PC Findings page offers three dropdown filters and four action icons.

Filtering Options
The three filtering options allow you to select which findings to display based on the following attributes.
| Filter Type | Definition |
|---|---|
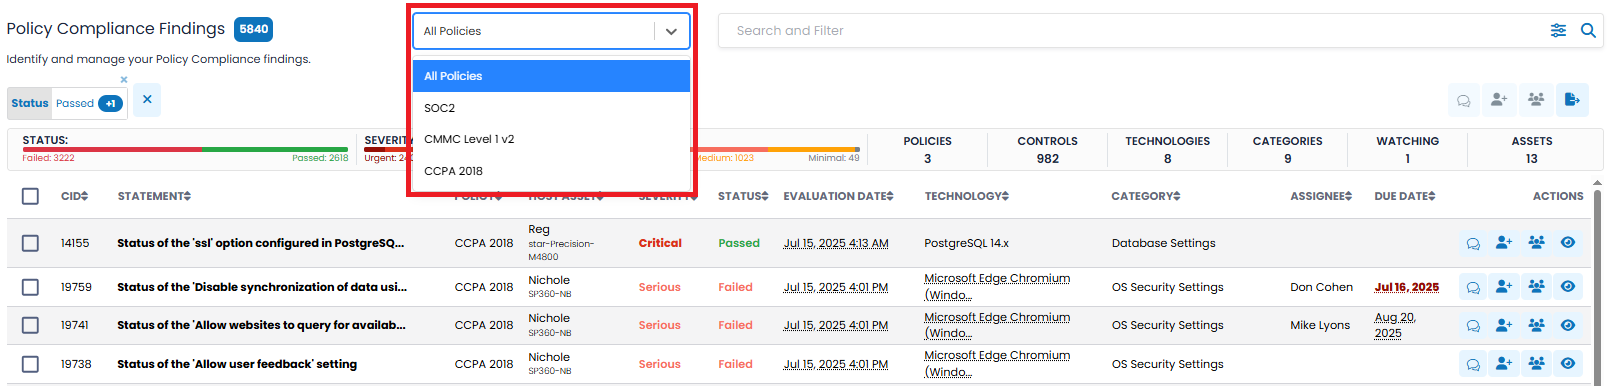
| Policy Dropdown Filter |
This dropdown allows users to focus on a specific subset of compliance standards configured for their organization. At the time of purchase, each organization designates which policies are relevant to them (e.g., in this sample, 3 out of 28 possible standards have been designated as “in play”). Only those selected policies are made available in the dropdown as a result of that configuration. This filter helps users temporarily narrow their view — for example, to assess performance specifically against SOC2 or ISO 27001, depending on current compliance goals or audit needs. Sample options (configured per client):
Note: The list above is for illustrative purposes only and will differ based on each organization's selected standards. |
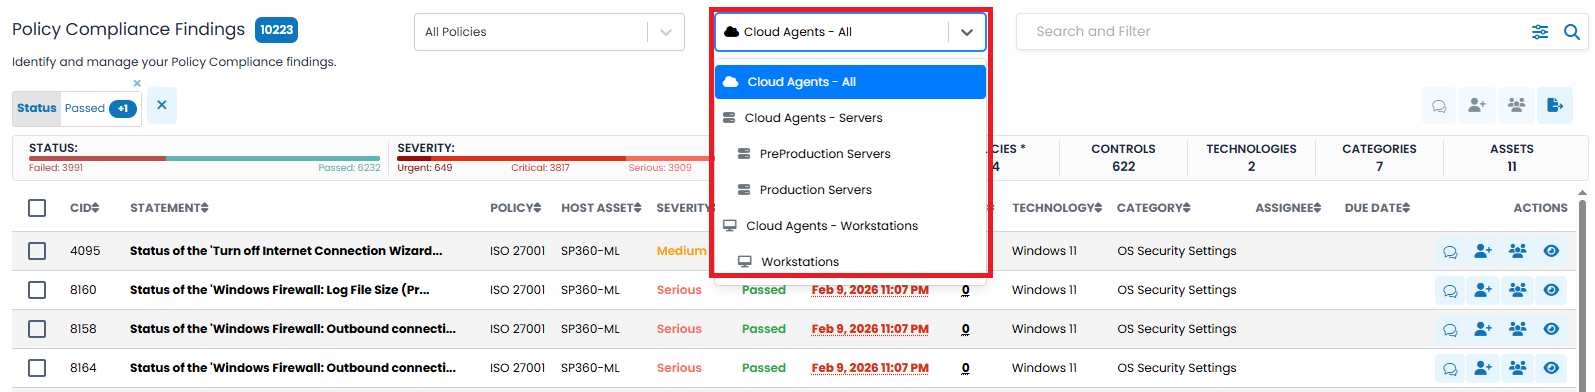
| Asset Type |
This dropdown filter allows users to refine the PC Findings list by asset type or asset group. Because compliance environments may generate a large number of findings across many systems, this filter helps users quickly focus on findings associated with specific categories of assets, such as servers or workstations. The dropdown displays predefined asset categories configured within the environment. Selecting an option updates the Findings list to display only those findings generated from the selected asset type or asset group. Examples of available options may include:
This filter allows users to more efficiently investigate findings related to the assets most relevant to their operational or remediation priorities. |
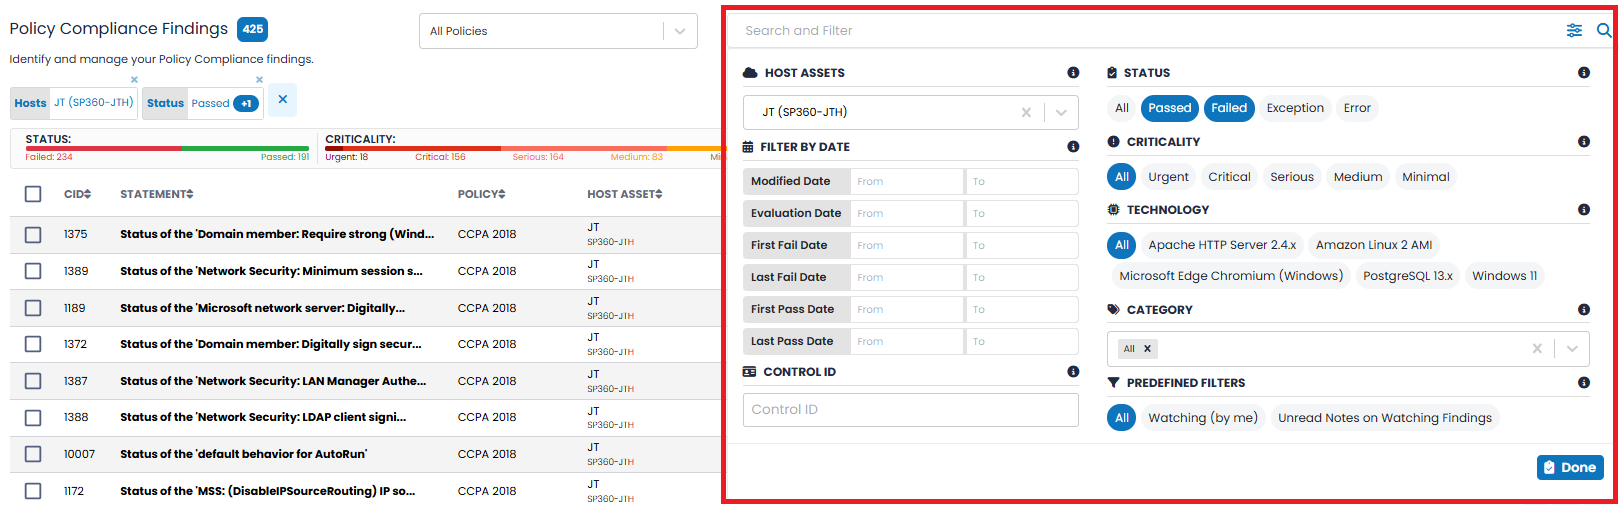
| Search and Filter Control |
Allows you to select and filter findings based on the different attributes defined below. Note: Not all filter types apply to all policy frameworks. When a specific policy is selected, one or more filters may either (a) be hidden from view, or (b) automatically clear any selected values that no longer apply.
|
Action Icons (Bulk Operations)
The checkboxes on the left of each finding row allow users to select one or more findings and apply bulk operations, for example, assign the selected set to the same person. The “Selected” control (which only appears when one or more findings are selected) shows the number of findings selected and that will be impacted by any bulk operation.
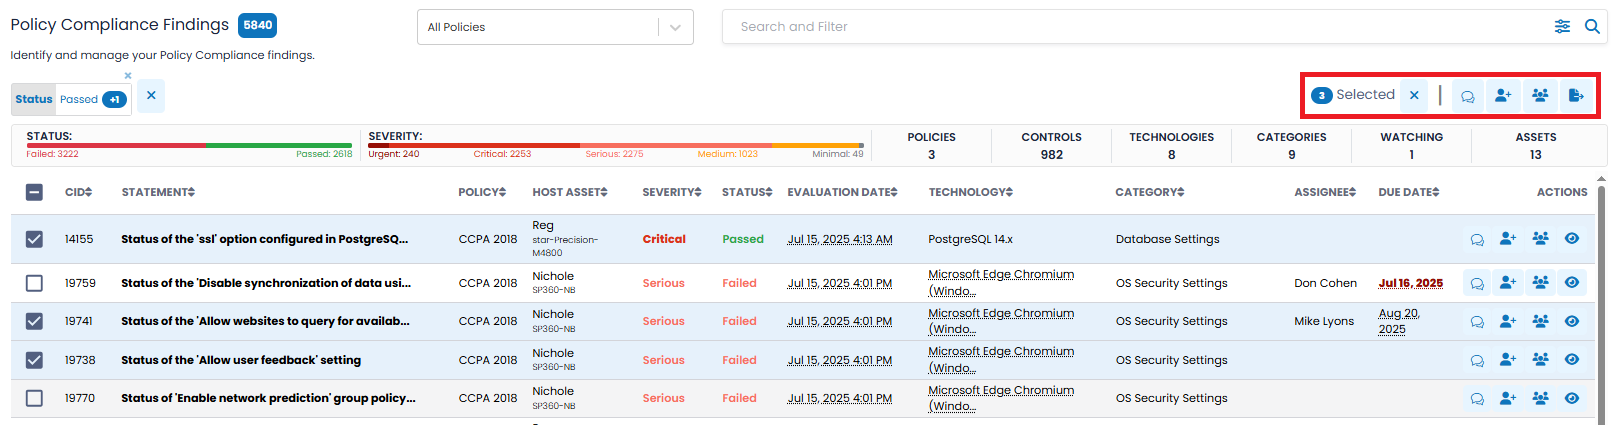
There are four bulk actions 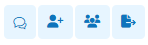 available:
| Action Icons | Function |
|---|---|
| Clicking this icon results in marking all notes as read for selected findings. | |
|
When clicked, a pop-up window appears, showing the Policy, Control, and Control ID associated with the selected finding. From this screen, you can:
This in-line assignment feature streamlines task ownership and simplifies compliance tracking. 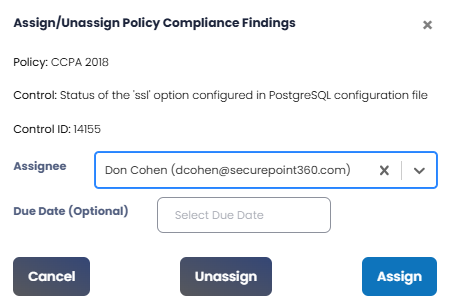
|
|
|
In the pop-up, users can select team members from the drop-down list to assign or unassign as watchers. Once members are selected, the Assign and Unassign buttons will become active based on the action required. Watchers will be notified of any updates to the selected findings, including notes, status changes, or reassignments. 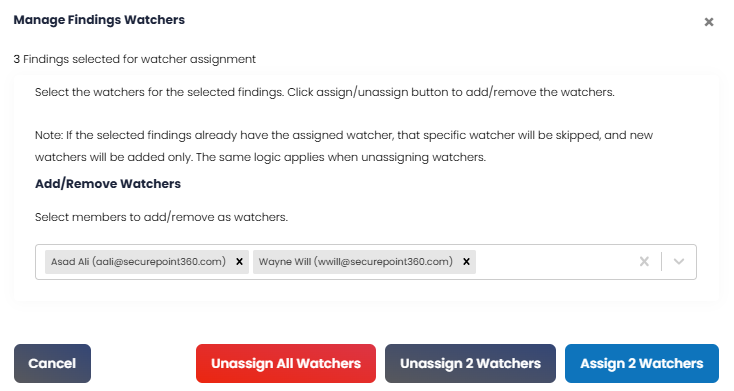
|
|
| Clicking on this icon downloads (in CSV format) all details for all/selected findings. |
Policy Compliance Insights Bar
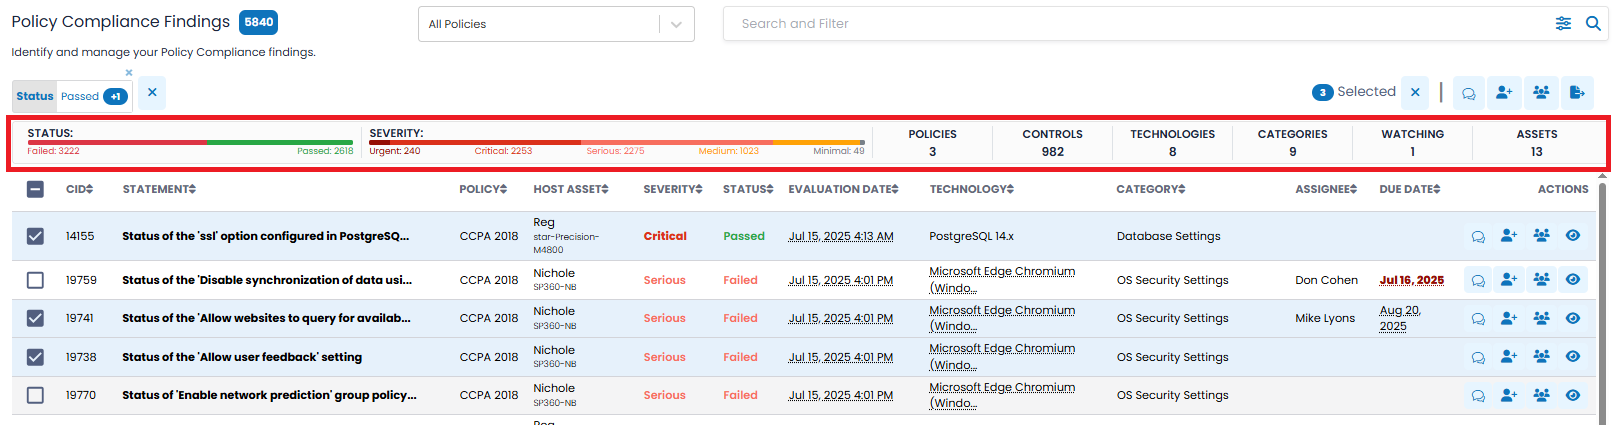
The Policy Compliance Insights Bar provides a high-level summary of compliance evaluation metrics for all findings visible based on the current filters. It helps users instantly assess the scope and severity of compliance issues within their environment.
This bar includes two visual indicators – Status and Severity – followed by several numerical summary tiles, all explained below.
- STATUS Bar: This horizontal bar displays the overall compliance outcome based on the latest evaluation:
- Failed (Red) - Total number of checks that failed policy evaluation (i.e., were found non-compliant).
- Passed (Green) - Total number of checks that passed policy evaluation and are considered compliant.
This breakdown provides immediate insight into how many controls are currently violating the defined standards versus those that are in good standing.
- SEVERITY Bar: This segmented bar categorizes the failed controls by their severity level:
- Urgent – Highest priority issues requiring immediate attention.
- Critical – Severe issues with significant risk exposure.
- Serious – Moderate-risk findings that need scheduled remediation.
- Medium – Lower-priority compliance gaps.
- Minimal – Informational or negligible-impact findings.
Each segment is color-coded and labelled with the corresponding count of findings, enabling users to quickly triage and prioritize based on risk level.
- Summary Tiles: To the right of the bar charts are key numeric indicators that provide contextual scope:
- POLICIES – Count of distinct policy frameworks evaluated (e.g., CCPA, SOC2).
- CONTROLS – Total number of unique configuration checks evaluated against the policies.
- TECHNOLOGIES – Number of technology platforms (e.g., Windows 11, macOS) evaluated.
- CATEGORIES – Number of compliance control categories represented in the findings (e.g., Encryption, OS Security Settings).
- WATCHING – Number of findings currently being watched by the user or others (used for tracking changes or updates).
- ASSETS – The number of unique host assets included in the filtered results.
These summary counts update dynamically as filters are applied, providing a real-time overview of the compliance landscape tailored to the user's focus area.
Policy Compliance Findings Grid
The Policy Compliance Findings grid provides a tabular view of individual compliance checks evaluated against selected policies and host assets. The Findings grid includes the following fields by default, however, users can customize the grid to add, remove, or re-arrange fields to meet their needs by clicking the  action icon at the bottom right, explained here.
Each row in the grid represents an individual compliance finding, structured into the following columns:
| Column Headers | Definition |
|---|---|
| CID | The Control Identifier – a unique Qualys-assigned ID number for the evaluated policy control. |
| STATEMENT | A truncated (50 characters) description of the policy check. Hover to view full text. |
| POLICY | The compliance framework used for evaluation (e.g., CCPA 2018). |
| HOST ASSET | Displays the name of the host (and alias, if applicable) on which the policy check was evaluated. |
| SEVERITY | Indicates the severity level of the control based on predefined risk ratings: Urgent, Critical, Serious, Medium, Minimal. |
| STATUS | Displays the evaluation result: Passed (compliant) or Failed (non-compliant). |
| EVALUATION DATE | Timestamp of the most recent scan or check execution that produced the current result. |
| TECHNOLOGY | The platform on which the check was executed (e.g., Windows 11, Linux, macOS). |
| CATEGORY | Logical grouping of the control, such as Encryption or OS Security Settings, used for filtering and comparative analysis. |
| ASSIGNEE | Displays the user responsible (if any) for addressing the selected compliance finding. |
| DUE DATE | Shows the target date by which the assigned finding should be resolved (if specified). |
To learn more about the optional fields that can be added, removed, or re-arranged in the Findings grid, click here.
Each Finding has four row-level action icons on the right side of each line.
| Icons | Description |
|---|---|
Add Notes |
Clicking on this icon displays a pop-up window in which you can add, review, edit, or delete descriptive notes related to a finding’s status. 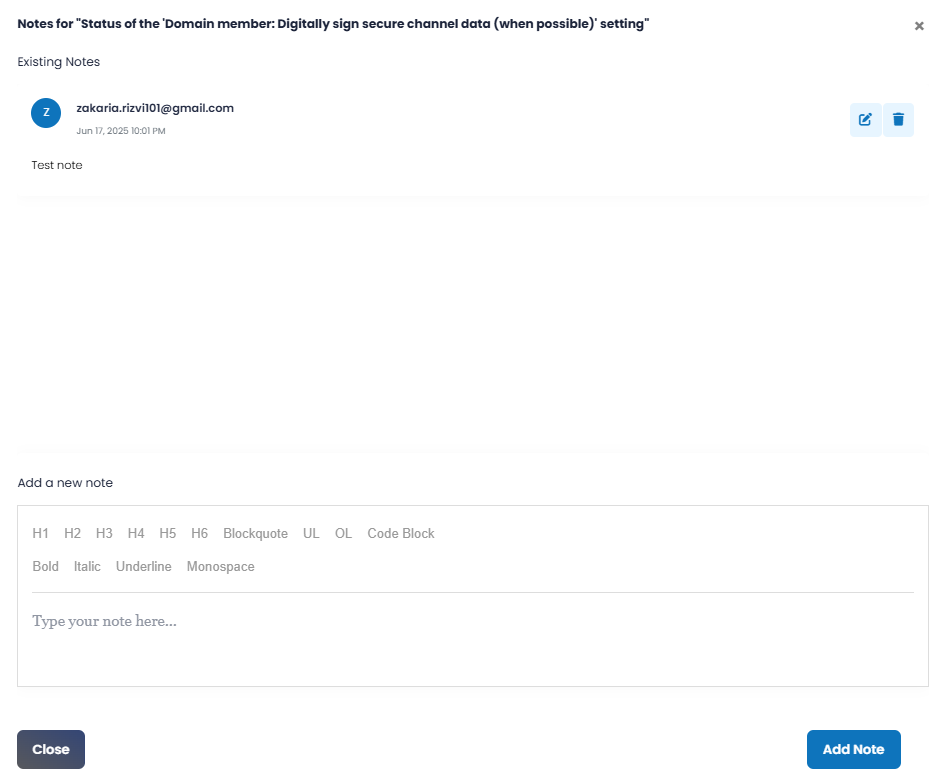
Note: Only the user who added a note can edit or delete it. If descriptive notes have been added for a finding, a superscript next to the icon will indicate the number of notes, as shown below. 
|
Assign/Unassign |
Clicking the row-level Assign/Unassign icon opens a pop-up window for the selected finding. The window displays key details, including the Policy, Control, and Control ID associated with that row. From this screen, you can:
This targeted, in-line assignment feature enables quick task delegation directly from the grid — without needing to use bulk actions — and helps streamline compliance tracking at the individual finding level.
|
Add Watchers |
Clicking on this icon allows you to add multiple users (one-by-one) as watchers for a given finding. You can add a watcher by selecting the user from a drop-down. You can remove users from the watchers’ list by clicking the Remove 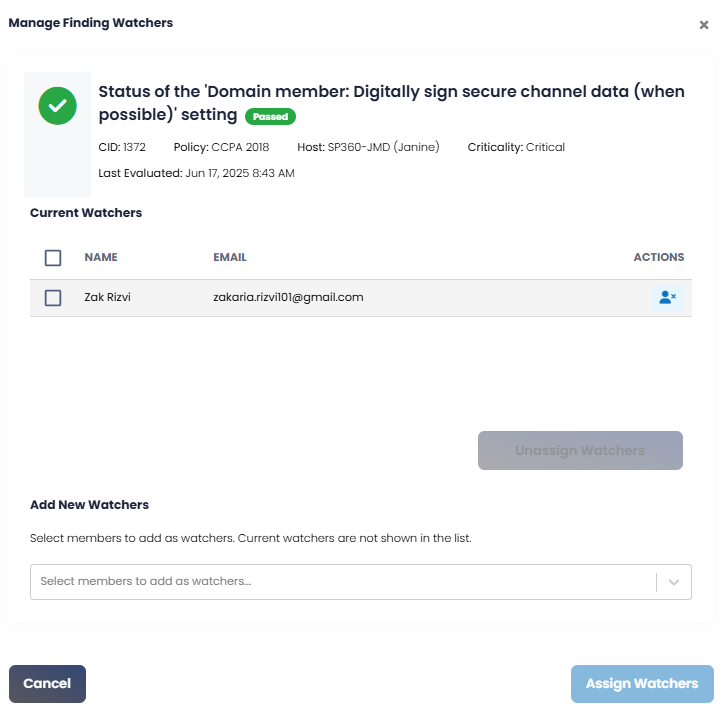
|
 View Details |
Clicking on this icon displays a pop-up window with additional details related to the finding as shown below. This Details page is the most critical information for understanding and resolving findings. 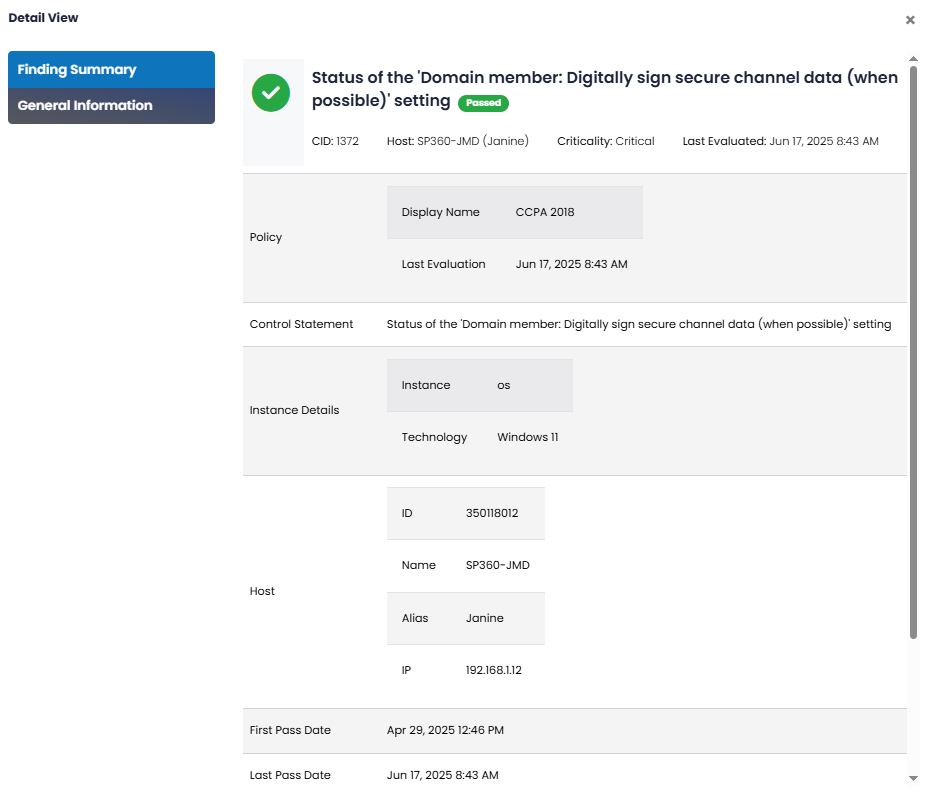
|
 icon. The finding watchers will get notified of any change in the status of the specific finding, or notes are added, or the finding assignment changes.