Endpoints Dashboard
Endpoints are the connection points for any of your organization’s applications, systems, tools or services which can be accessed over a network. Typically, more than 50% of security breaches originate at the endpoints, so it is a crucial task to maintain proper “cyber hygiene” and monitor these security risks.
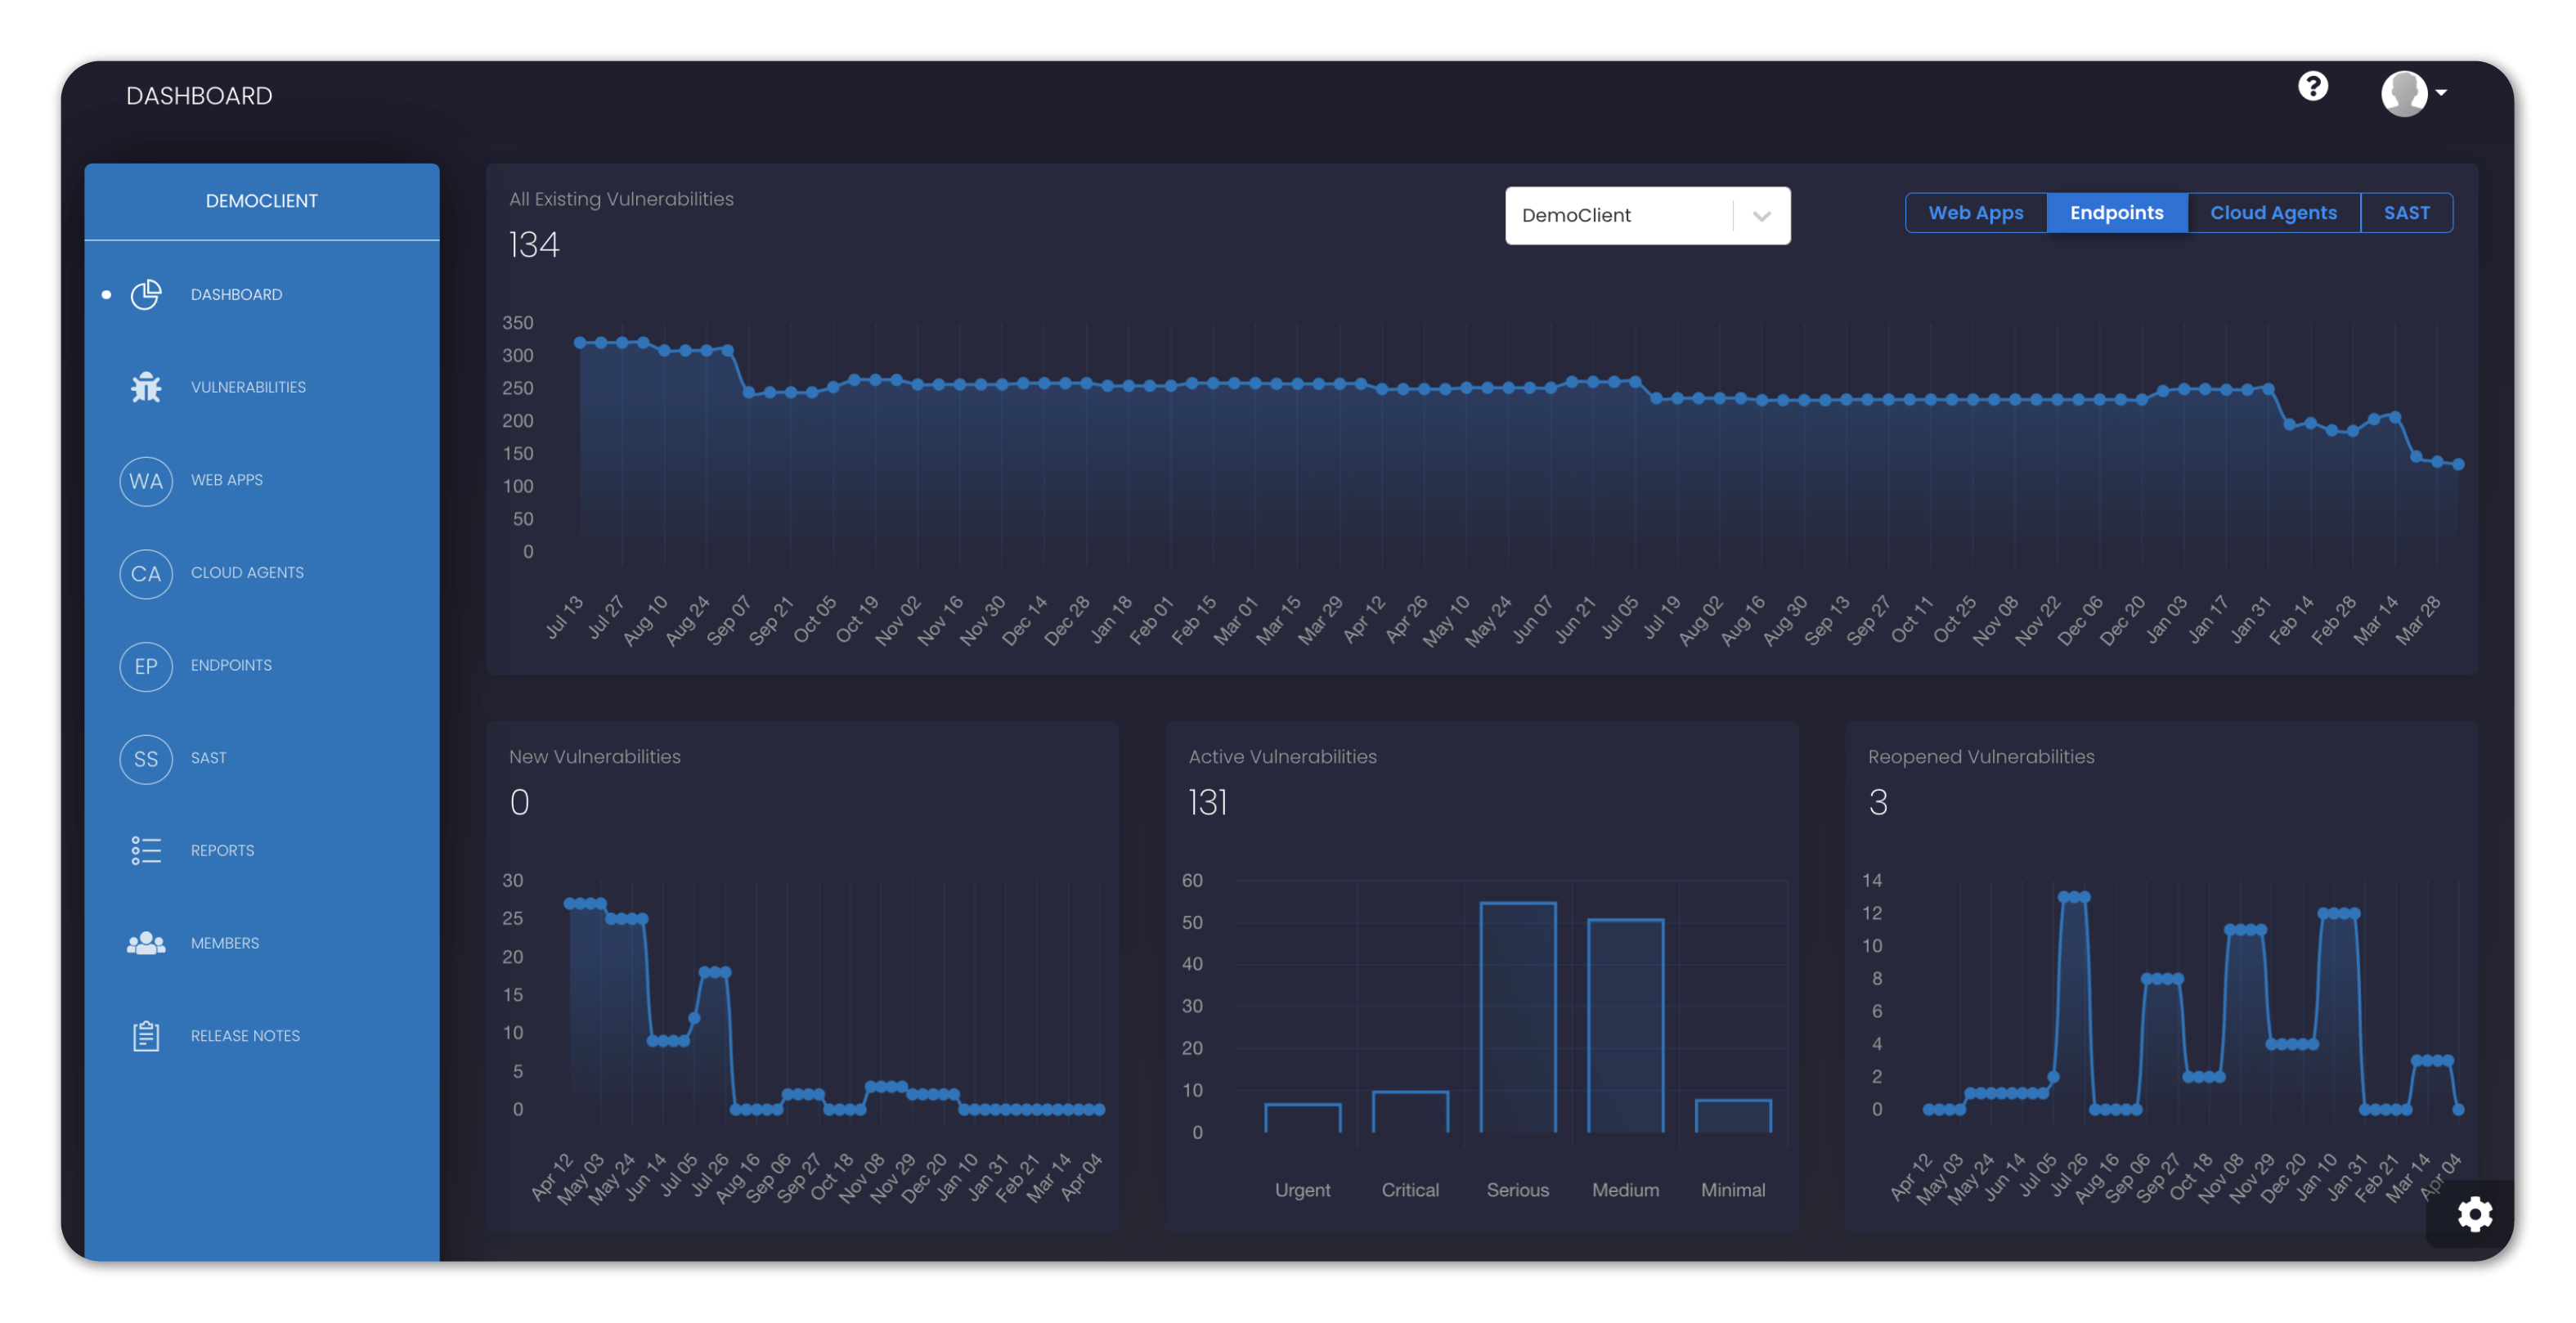
SP360 scans your organization’s endpoints weekly and displays the vulnerabilities data in graphic format (as shown below) segmented as:
• All Existing Vulnerabilities
• New Vulnerabilities
• Active Vulnerabilities
• Reopened Vulnerabilities
• High Severity
• Patchable
• Obsolete Software
| Graph Types | Definition |
|---|---|
| All Existing Vulnerabilities | SP360 scans all targeted web apps for vulnerabilities weekly and displays the total number of outstanding vulnerabilities. The vulnerability count is a sum total of New Vulnerabilities, Active Vulnerabilities and Reopened Vulnerabilities. Most organizations find this very insightful because it indicates whether they are keeping up with the backlog of vulnerabilities. |
| New Vulnerabilities | SP360 will also track newly discovered vulnerabilities (i.e., in the last week). Most organizations find this insightful and will correlate these numbers to their most recent development efforts. |
| Active Vulnerabilities | SP360 will partition the known vulnerabilities by their criticality since most organization will address the high priority issues first. |
| Reopened Vulnerabilities | A reopened vulnerability is one that was previously considered closed but has been rediscovered. Obviously, organizations do not want to be reverting to old problems, which makes highlighting this scenario valuable. |
| High Severity | This chart denotes specific vulnerability types that are high priority, and to some extent overlaps with one of the previous charts. Its purpose is to highlight vulnerabilities that should get immediate attention. |
| Patchable | This chart denotes vulnerabilities that can be addressed by applying the latest vendor patches (e.g., Microsoft Windows patches). The reasons these are highlighted are twofold: (a) they are relatively easy to address, and (b) your organization should get in the habit of regularly applying patches. This is one of the “best practices” that any organization should adopt. |
| Obsolete Software | This chart denotes vulnerabilities that are due to utilizing obsolete software and applications. While not as easy as applying patches, using obsolete (unsupported) vendor applications leaves you very exposed to the latest security threats, and a remediation plan should be developed. |
Further down the Dashboard, one can see the Vulnerability Counts partitioned by the individual endpoint, which is most easily recognized by its IP (address). Also potentially interesting is the date the endpoint was most recently scanned.
![]()
Every Endpoint has three available action buttons as indicated by the icon on the right side of each IP:
| Icons | Definition |
|---|---|
 |
This icon will redirect you to the VULNERABILITIES page, where you can get the list of all vulnerabilities for that specific Endpoint |
 |
This icon will show the additional details related to each specific vulnerability, in a popup window. . Information such as the location of the vulnerability and a potential remediation. |
 |
This icon returns you to the top of the dashboard, which might be helpful if there is a long list of endpoints, and you have scrolled to the bottom. |
| To assign an alias to an endpoint. Once the alias is assigned to an endpoint, the alias will appear just below the IP of the endpoint. |